◆ main()
| main | ( | ) |
example program
Just a simple example to show how the pgplot classes may be used.
- See also
- pgplot::device
Definition at line 54 of file pgplotxxdemo.cc.
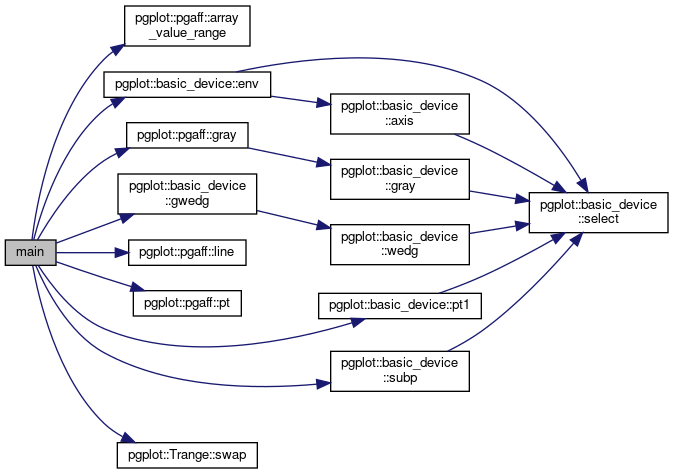
References pgplot::pgaff::array_value_range(), pgplot::basic_device::env(), pgplot::pgaff::gray(), pgplot::basic_device::gwedg(), pgplot::pgaff::line(), pgplot::pgaff::pt(), pgplot::basic_device::pt1(), pgplot::basic_device::subp(), and pgplot::Trange::swap().
pgplot::basic_device & gray(pgplot::basic_device &dev, const Tarray &a, const pgplot::Trange &range, const Ttransform &tr)
function to plot gray image
Definition: affpgplot.cc:52
basic_device & gwedg(const Trange &range, const char *label="value", const float &disp=0.3, const float &width=3.0, const char *side="RG")
annotate an image plot with a wedge
Definition: basicdevice.h:537
basic_device & env(const float &xmin, const float &xmax, const float &ymin, const float &ymax, const int &just=0, const int &axis=0)
define PGPLOT window and axis
Definition: basicdevice.h:153
T & line(T &dev, const SX &x, const SY &y)
draw an open polygon from a dense series
Definition: affpgplot.h:112
T & pt(T &dev, const SX &x, const SY &y, const int &s)
draw symbols from series
Definition: affpgplot.h:198
Here is the call graph for this function:

